Generalities
PAP (p-azoxydiphenetol) [1,2,3,4], has two distinct solid states and one nematic phase from melting point down to 100K. Phase I, stable above 356 K is described in a triclinic space group. Phase II is modulated and disordered, the central oxygen being randomly distributed between two sites. The phase transition I->II is irreversible. Recent X-ray diffraction experiments have shown that the PAP modulated phase is disordered as indicated by the presence of diffuse scattering. Many satellite reflections in the reciprocal space reveal the presence of the modulation.
Recent DSC experiments have confirmed that PAP presents three phases transitions between 293 K and 453 K. On the figure 1 ("1st cycle"), one can distinguish the transitions incommensurate->commensurate, commensurate-nematic, and nematic->isotrope. From 453 K to 293 K, on the other hand, one can observed two phases transitions only. The phase transition commensurate->commensurate doesn't occur (at least in this temperature range).

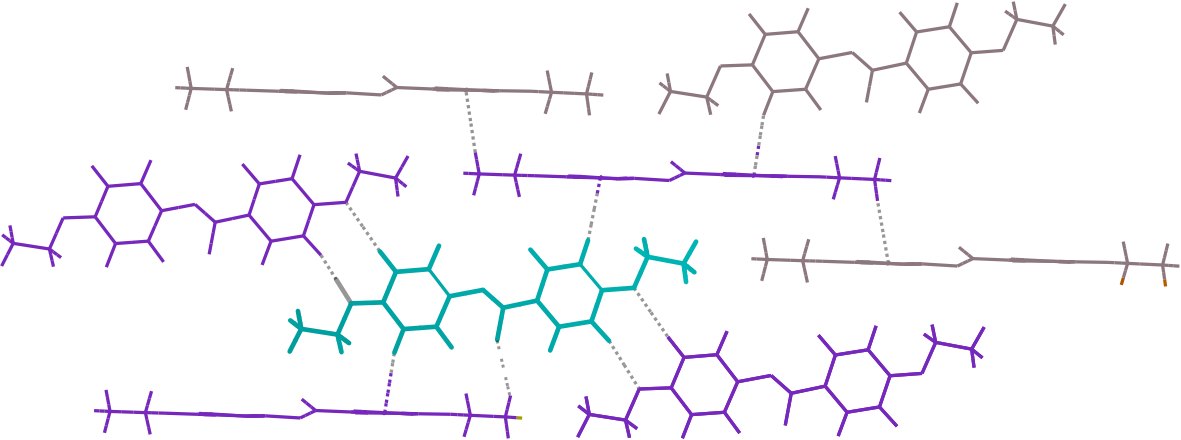
PAP is build up by 39 atoms and a dative bound belongs to the azoxy group. The figure 2 shows the average PAP molecule whith its disordered oxygen. Pictures of the two crystal phases are also displayed.

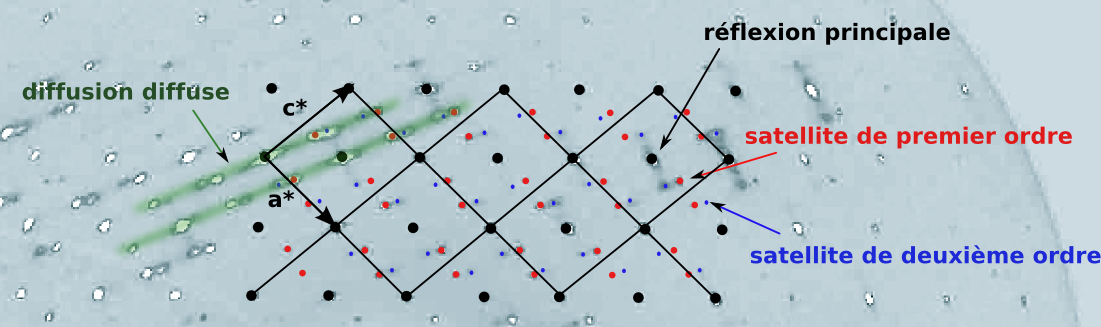
The figure 3 represent the (h0l) plan of the incommensurate phase at 120 K. One can clearly see first and second order sattelite as well as diffuse scattering.
Computational methods
In order to perform atomistic simulation of the incommensurate phase, parameter of the cff91 force field was used. Two kinds of simulation where carried out with around 1'000'000 atoms (~ 25500 molecules).
First of all, an home made Monte Carlo code was developed to simulate the disorder. This program used the Metropolis algorithm and took into account only the four neighbours of each molecules as shown in the figure 4. Finally, a structure with a disordered oxygen was obtained. By then, this resulting structure initialised the Molecular Dynamics simulation. This was done with the program ddgmq [a]. Molecular Dynamics investigation was performed in NVT and NPT ensembles.
Results
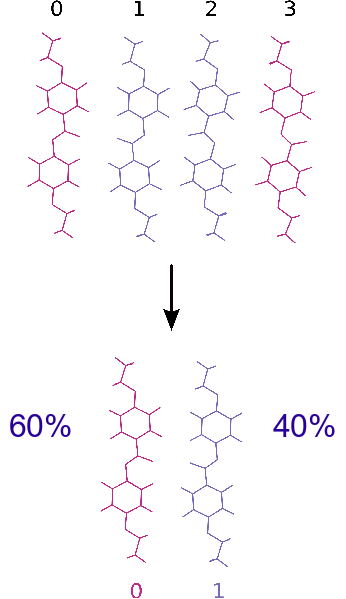
In order to simulate the disorder, a model based on four "orientations" was used, see figure 5. One can distinguish two whith the oxygen on the left and two whith the oxygen on the right. Finally, the MC simulation gave rise to a structure with only orientation 0 and 1, at 60% and 40% respectivelly. This result is in agreement whith the refinement of Carlos Pinheiro [3]
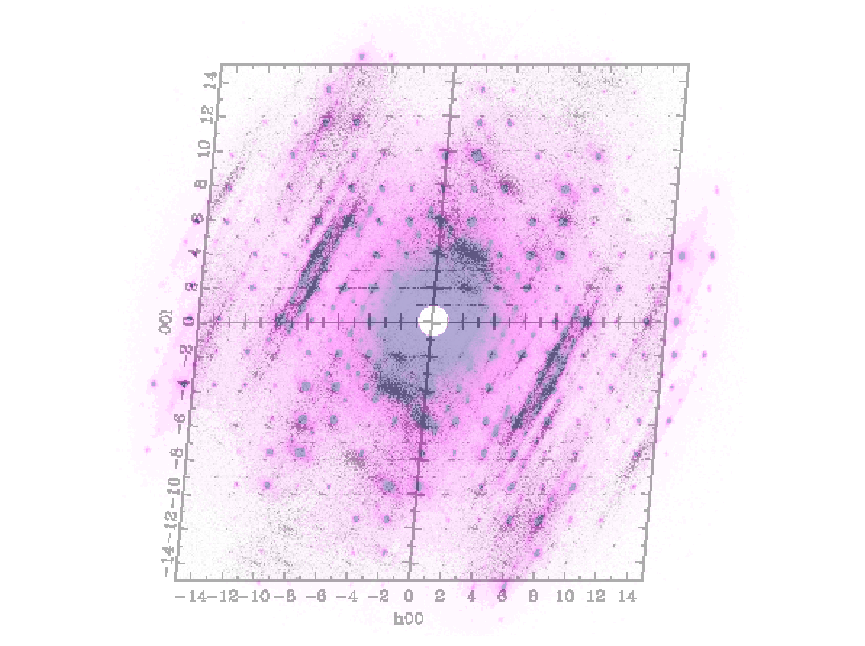
The figure 6 shows the (h0l) plan measured and simulated after the MD run. The calculation of the diffraction patterns was done with the
program DISCUS [b,c] from the DIFFUSE package. One can clearly see that the simulated diffuse scattering
is pratty well reproduced. The intensity and the direction fit very well with the experimental picture (see figure 7).
This means that interactions in the PAP strcture are somehow reproduced by the simulations.
On the other hand, no satellites are present in the simulated diffrection pattern, but, one can observed diffuse scattering in the
same direction. Even the simulated system contains a huge number of atom, it's probably not enought to simulate an
incommensurate structure containing
around 1023 particules. Moreover, incommensurate behavior is due to long range order interactions.

More results will be presented after the publication of [4].
References
| 1. | P. Sciau, J. Lapasset, and J. Moret.
"Structure de la phase triclinique (phase II) du 4,4,'-azoxydiphénétole".
Acta Crystallographica C, 44 (1988), 1089-1092 |
| 2. | C. Pinheiro, M. Gardon, P. Pattison, and G. Chapuis.
"Correlation between modulation and structural disorder in the 4,4'-diethoxyazoxybenzene".
Ferroelectrics , 305 (2004), 83-87 |
| 3. | C. Baslìo Pinheiro, E. Germaneau, P. Pattison, M. Gardon, and G. Chapuis.
"Modulation and structural disorder in the solid phase of the p-azoxyphenetol".
submitted for publication |
| 4. | E. Germaneau, K. Schenk, M. Bonin, and G. Chapuis.
"p-azoxydiphenetol: A computer simulation investigation".
in preparation |
| a. | D. Brown, H. Minoux, and B. Maigret.
"A domain decomposition parallel
processing algorithm for molecular dynamics simulations of systems of
arbitrary connectivity".
Computer Physics Communications, 103 (1997), 170-186 |
| b. | Th. Proffen and R.B. Neder.
DISCUS, a program for diffuse scattering and defect structure simulations - Update.
Journal of Applied Crystallography, 32 (1999), 838 |
| c. | Th. Proffen and R.B. Neder.
DISCUS, a program for diffuse scattering and defect structure simulations.
Journal of Applied Crystallography, 30 (1997), 171 |
Requiering some help ...
- I'm looking for the Raman and/or the INS spectrum of phase I and/or II, please let me know whether you can provide me the data by writting to this email: germaneau_tagada_ecs.umass.edu.